11 June 2026
Volume is not a colour on the histogram
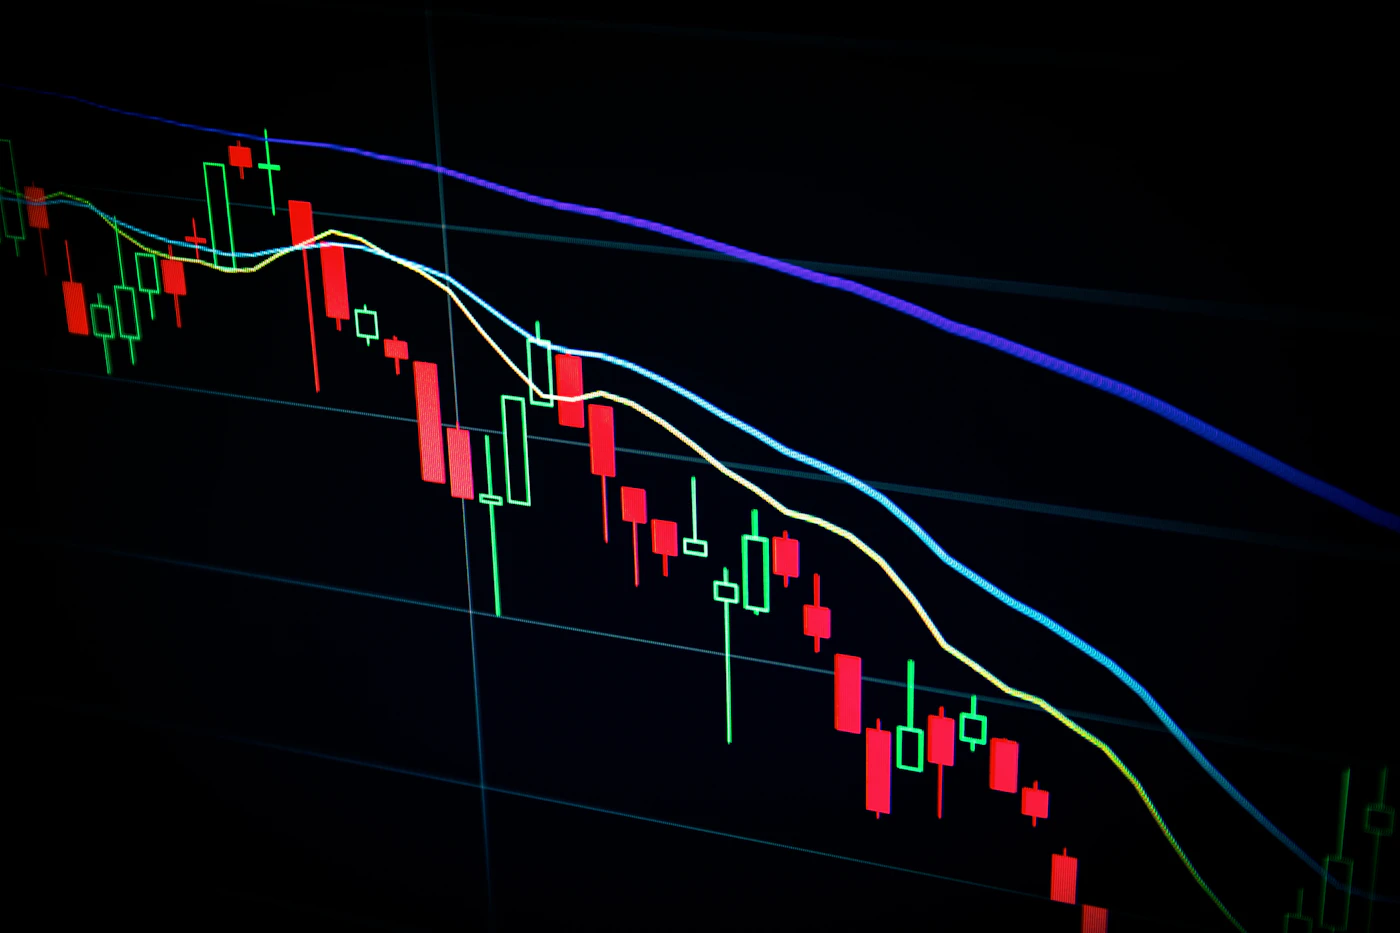
A histogram that paints up-bars green and down-bars red teaches the eye to double-count price. In our Volume Price Analysis Course we print charts in monochrome first. You write a short effort note under each cluster before anyone is allowed to colour anything.
The useful question is comparative: did this bar spend more activity than the last three of similar length? Did price travel, stall, or reverse after that spend? Those answers survive a change of platform. Colours do not.
If you already use a coloured volume pane, try two weeks of greyscale printouts from the instruments you actually watch. Bring the pack to a clinic if you want it marked in the room.